"Who deserves a discount? Your CEO wants you to send a discount code out to your best customers, and any that you think could be upsold or might be slipping away. How do you do the analysis to categorize your customers?
GoolyBib Office – Early Morning
Hey, we need to do something to boost the numbers for the end of the quarter.\nI was thinking we could run a CRM campaign to offer a discount to our best customers.\nIt also makes sense to target anyone who looks like they could be upsold, and those that bought a lot in the past but not recently.\nCan you do some analysis of the data and send the customer IDs to IT?\nThey can schedule the email for sending
RFM Analysis This is a simple and intuitive technique for categorizing your customers based on their past purchase behavior. RFM stands for Recency, Frequency, and Monetary value. To conduct this analysis you calculate how many days since they last purchased from you (recency), how many orders or transactions they've completed total (frequency) and the total amount that customers have spent with you (monetary value). Then you categorize customers based on the quartile they fall into in each category. For example an RFM class of 1-1-1 means the customer is in the top 25% of each category: a top customer. A class of 2-1-1 might indicate that this was one of your best customers, but they haven't purchased recently, because they're only in the 2nd quartile for recency.\nThis information is invaluable for targeting in CRM campaigns. You can use these labels to find your best customers, identify people who used to spend a lot but might be slipping away, and customers who bought recently but haven't made many repeat purchases. Then you can conduct a VIP, winback or upsell campaign depending on what bucket they fall into.
Make sure your dates are properly formatted in Excel or GSheets or you're likely to get your Recency number wrong. The date format YYYY-MM-DD is preferred because it's immune to differences between countries.
RFM Analysis 
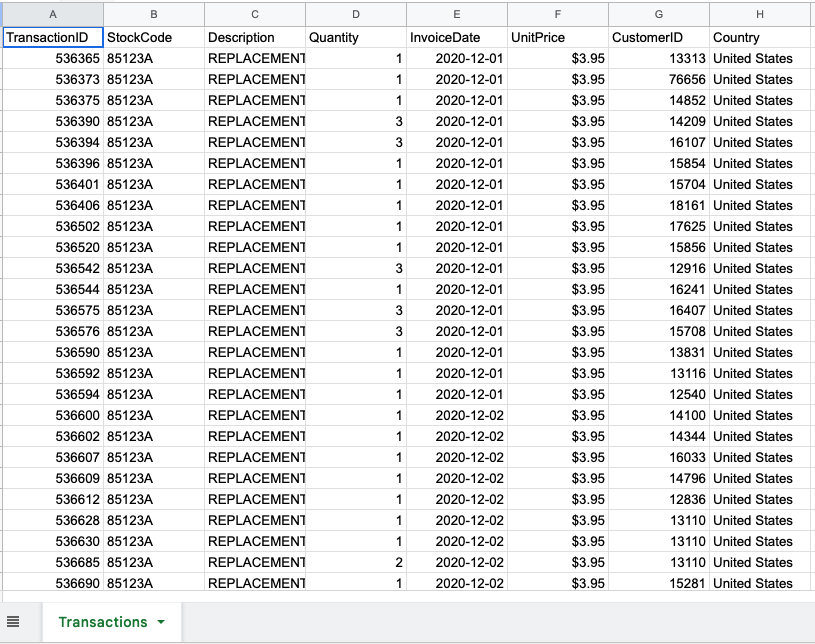
Hey, I'm going to show you how to do an RFM analysis. So this is the data that we have a transaction ID. Stock code is the different products as just two products, the replacement cover. And there's also. This smart bit which is further down so less of those and the higher price point than the replacement covers.\nWe also have a customer ID, which is the main thing we're going to be joining in order to share the recency, the frequency and the monetary value of each customer. Okay. So first let's work out the revenue. This is an easy one unit price, multiply it by the conceit of the. So just going to allow that to dropdown and you can see this work out there and then let's get the recency it's gonna shoot both days ago.\nAnd to get days ago, we just wanted to take today and then tracked the invoice date. Okay. So. This was in 2020 and you know, today it's 2022. So yeah, it makes sense is 458 days ago. And you can see that some of these were like 85 basic year. Which makes sense. Cool. Okay. One thing to watch out is if your date is in a weird format you can sometimes are ready to issue.\nAll right. So now we need to create a pivot table. I would, sorry. I'm just going to press command a or control a a, and then we're going to go to insert and then pivot table and put that in a new sheet. And what we need to do is pivot on the customer ID. So that's the customer ID and that's going to aggregate all of the transactions.\nYou can just add the Invoice or a transaction ID here. And then change this to account a yeah, I'm sorry. Yeah. And then you can just make this descending by count. You can see that there's one customer that bought 46 6 of course. So let's, so that is the frequency. And then we need to add.\nThe monetary value. So that's just the revenue that's pretty straightforward. And you can see that this how much revenue this customer has made. And then we also want to add the recency. So we're going to take days ago.\nOkay. We can see the days ago is the sum and we're going to change it to a, it's just the mid. So this will find the smallest days ago that, that customer has there we go. Okay. So now that we have that we want to sort these into quantiles and that means basically splitting into groups. You know, 25% of customers are in group one 25% in group two and so on.\nAnd the reason we did that is so we can get a score for, you know, how how high this customer up is up in the, in the, in the pecking order for these three different values. So let's do recency frequency. And we're just going to put them here as well.\nAll right. So what we want to do and actually let me just rearrange these. So just say they're in the right oldest or recency of days ago, and then frequency is transactions and then. Revenue. And I'm just going to show you one of these and I'll leave the rest for you as an exercise. So we need to sort into courthouse and that I'm just going to say these are the three both tiles.\nSo let's do recency. So we just need the core tile. And that takes the data and then the course on numbers. So that if we, you know, press to troll shift down and then I'm just gonna make sure I didn't get the total and that I'm just going to lock that in place for pressing a four or you put dollar signs in front.\nAnd then of course I'll just report. And what this is telling me is the the lowest the lowest kind of recency. Like if you, if you want to be in the the lowest 25% of recency your recency needs to be below 260. If we change this to three a, then that then anything above 393 would, would pay you in the worst 25% of recency.\nCool. So so that ones that actually, if you just put zero head and that's the men, so it's the lowest value. We can. Also bring out the second core tile, they should just be medium basically. And then copy copied across, and then we want them to know, we just need a quick function. It's a couple of nests.\nSo if the basic go is less than this then Oh, sorry. Get rid of that. Yeah, if there's is less than that value the low school. Then and we want to say it's in queue one. I'm just doing that as a string because we're not going to have the scores up. We're just going to have to, to show you 1, 1, 1 0 1, 2, 1.\nOkay. So and if it's not a low in that value, then we need to make another statement. So now we want to say if it's if that is. Lower than this, then it's going to be in cool tile too. And then if it's if that another statement. That is lower than quotes three. You know, then it's going to be three.\nAnd then if not, it's going to be pulled off for, because you know, then it means it's above that number. And then sort of close that statement close the second half statement close the first statement and that should work. Okay. So I'm just going to double click. Actually, let me just, before I double click this, to make sure this is in in absolute reference I say press at four or put dollar signs in front of it.\nCool. So just double click or if that's not working, you can kind of click copy and then paste all the way down.\nCool. So everything is broken into . Now I'll let you do the rest. You know, you do the same thing except in this case you you know, think about it, frequency or recency is a, is a low, is a good thing. With frequency high is a good thing. So in this case, you know, we're selecting seed. And then you can see.\nYou know, rather than quarter one, we actually puts out three here. So if you want to be able to put 25% of frequency, you have to have bought at least three things. Cool. So you know, this is just the same, but reversed. And then same thing with here. These signs will be reversed when you do frequency and then same for monetary.\nSo I'll leave you to do that exercise. Once you have. You know, the recency frequency and monetary then so say for example, this person is one-on-one. Then the RFM class would just be that I present that, that. It's going to be class 1, 1, 1, that'd be your best customer. Or you know, if it's you know, someone who has bought recently, I mean, it hasn't been recently, but it used to be your best customer.\nI, then that might be like a 2, 1, 1. So that's how you should think about the RFM class. Okay. Good luck.
What RFM class would someone fall into if they had bought recently and spent a lot of money, but haven't made many transactions?
If you send the discount to everyone in the 'Best Customers', 'Slipping Away' and 'Upsell Oppty', segments, what percentage of all customers will get an email?
If an RFM class of 121 is a customer who has bought recently and paid a lot of money, but hasn't made many purchases, how would you classify a customer that bought recently and often, but only for small ticket items?
Without big data analytics, companies are blind and deaf, wandering out onto the web like deer on a freeway
RE: Campaign results\nThanks so much for that analysis, the campaign looks like an early success.\nWe got good purchase volume from those upsell opportunities and won back 15% of those customers that were slipping away.\nWe even got a few thankyou emails from our top buyers!\nBest,
"