What will people pay for?
Should your new product be blue or red? $40 or $50? Organic or vegan? Giants like P&G and Unilever don’t leave these decisions up to chance. They use a market research technique called ‘Conjoint Analysis’ to figure out what people will pay for.
Conjoint Analysis
Conjoint analysis is a market research tactic that uses realistic hypothetical situations to understand consumer preferences...More


I loved the idea you pitched in the meeting of testing the different attributes of our new product launch.
Of course I have my opinions but I’m interested in what combination of features people would buy
This will be relevant data for our investors to see also
Can’t wait for you to run the Conjoint Analysis!
This course is a work of fiction. Unless otherwise indicated, all the names, characters, businesses, data, places, events and incidents in this course are either the product of the author's imagination or used in a fictitious manner. Any resemblance to actual persons, living or dead, or actual events is purely coincidental.
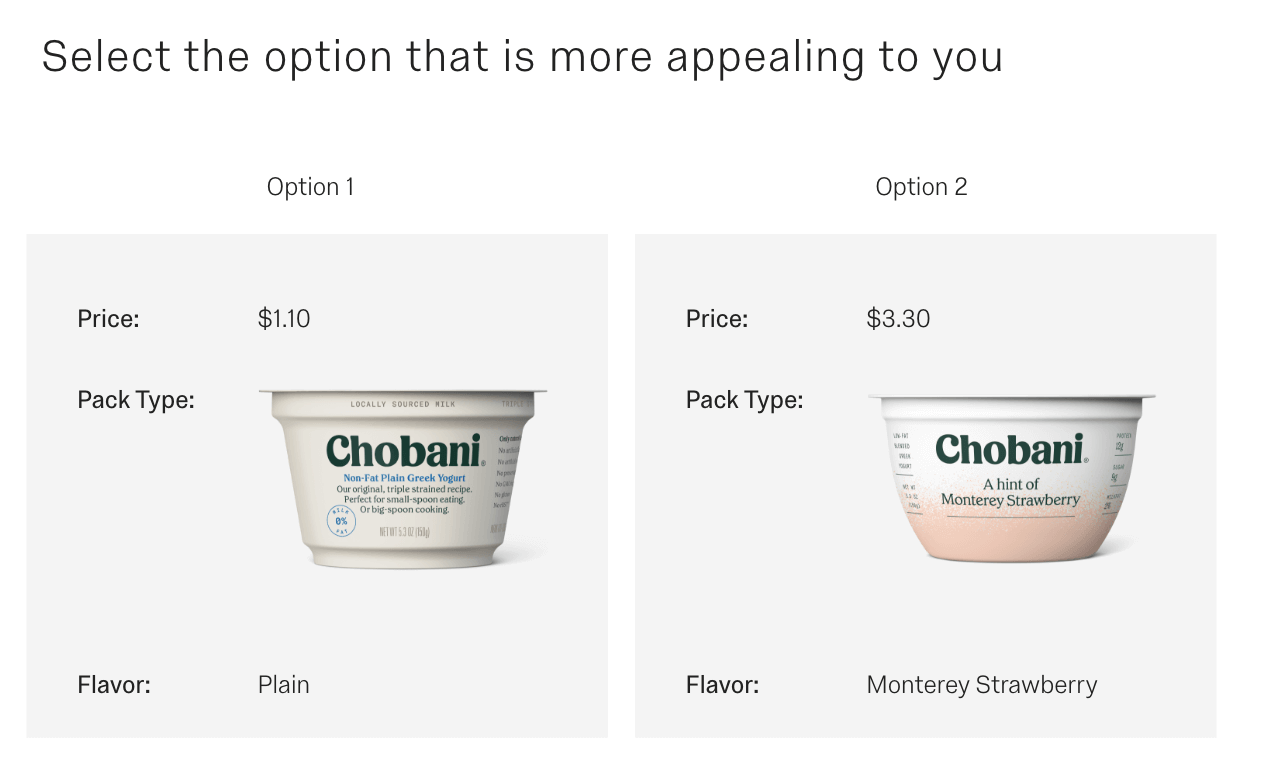
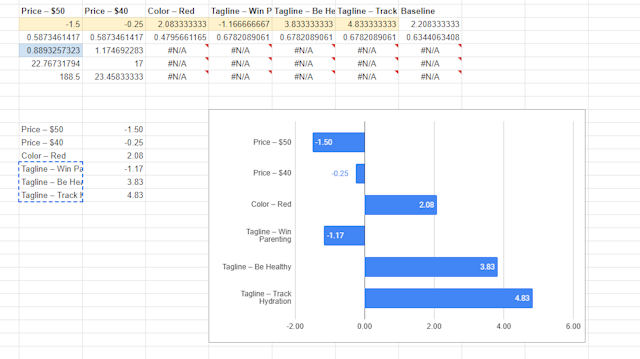
People have different preferences about what to buy, and one of the main jobs of marketers is to appeal to those preferences so they can sell their products. It wouldn’t be a useful exercise to just ask the open ended question “what do you want to buy?”. As Steve Jobs said, “People don't know what they want until you show it to them”. Conjoint Analysis is a market research method that shows people different combinations of attributes for a new potential product (or an existing product on the market) and asks the consumer to choose between usually 2-3 options. Attributes could be different prices, product features, taglines, logos, packaging, colors, really anything you deem important to the success of the product.
These cards containing unique combinations of attributes get shown at random to the target group, and therefore you can get relatively unbiased data on which features are actually important to the market. For example one user might see a blue product that costs $40 with the tagline “Win Parenting”, next to a red product at $50 with the tagline “Be Healthy. Another user might see a red product at $40 with the tagline “Be Healthy” next to a blue product at $50 with the tagline “Win Parenting”. Using Regression Analysis, it’s possible to disentangle these choices and determine what the relative importance was of each feature in terms of predicting user preferences.
Typically these analyses are done with a specific survey tool like Qualtrics, Conjointly or Sawtooth. These tools handle the asking of the questions and the analysis afterwards, as well as providing flexible rules for how those questions are asked. It is possible for you to create your own survey however, you just need to account for every combination of the product attributes, which can be tiresome to set up. For example if you had 4 taglines, 2 colors, and 3 prices to test, that would be 4 x 2 x 3 = 24 variations. One thing to remember in terms of the final analysis: when doing regression analysis you need to drop one category from each attribute. So for example the data would have columns for 3 out of 4 taglines, 1 of the 2 colors, and 2 of the 3 prices. This is because the first row would have all zeros, and therefore would be the baseline in the regression. It would represent the option of Tagline A, Color A, and Price A. Then as you move down the rows it would be a zero or one depending on if that attribute was present in that card or not.
Once you’ve got your data and you do the regression analysis, you’ll have coefficients you can use to predict preferences. You can simply select the coefficients that are highest, one from each attribute. It’s also valid to choose for example a higher price if the coefficient is not too much more negative, as that might improve the profitability of your product. In advanced Conjoint Analysis tools it’s also possible to use these coefficients to predict market share, though that’s complicated to do, relatively theoretical, and rarely correlates to the real world, so is outside the scope of this tutorial.
Complete all of the exercises first to receive your certificate!
Share This Course