What's driving performance?
How much did a metric move the needle? It’s easy to say which metrics went up or down week on week, but how much did they actually contribute to conversions? To figure that out you need a waterfall chart.
Waterfall Charts
Waterfall charts decompose the various factors that contribute to a metric, so you can see how much each one drove the metric up or down...More


I understand that conversions are down
I understand that it’s likely because of the drop in conversion rate
What I don’t understand is how impactful that was
So for example, how many conversions did we lose thanks to lower conversion rates?
What did the other factors contribute? Can we work that out?
This course is a work of fiction. Unless otherwise indicated, all the names, characters, businesses, data, places, events and incidents in this course are either the product of the author's imagination or used in a fictitious manner. Any resemblance to actual persons, living or dead, or actual events is purely coincidental.
It’s important to know how your performance is trending, because you need to take steps to correct poor performance, as well as being quick to double down on good performance. Most marketers will identify conversions have fallen, then look deeper into what metrics may be causing it. If CTR (Clickthrough Rate) has fallen, it might be an issue with our ads. If CVR (Conversion Rate) has fallen, maybe it’s the quality of the traffic. We could also look at search impression share and see if maybe we’re being outcompeted for inventory. Looking at these metrics as a way to explain what’s going on, and then taking action to correct performance issues, is a key part of every marketer's role.
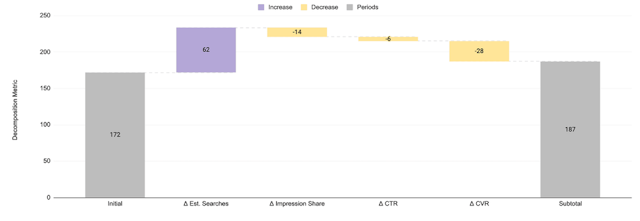
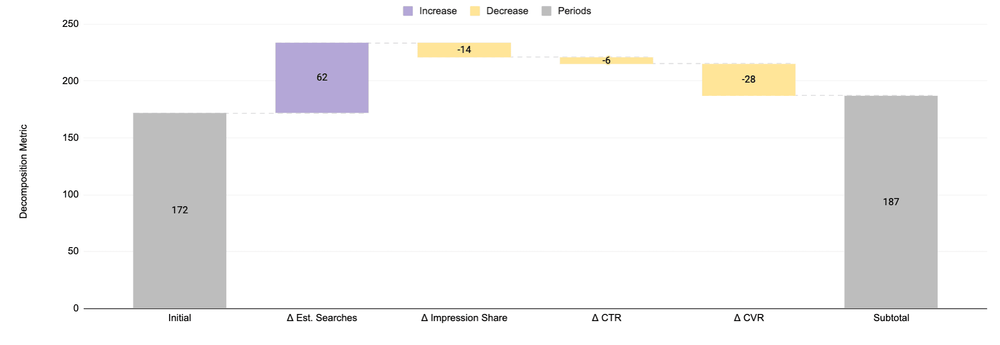
However it’s not enough to just eyeball the metrics. Yes CTR is down by 50% or Impression Share is up by 10%, but how much individually did those metrics contribute to the overall conversion number we hit? Without knowing how impactful each change was you can’t properly prioritise the right actions to improve them. In order to figure this out, you need to decompose the contributions of each metric and display it in a waterfall chart. The chart shows initial conversions on one side, positive and negative contributions by metric in the middle, and finally the resulting conversion numbers. It can be thought of as a kind of marketing funnel visualisation, because each metric contributes to the final figure, and the sum of their contributions totals to zero. The maths to do this is a little complicated, because it requires stepwise calculations, so we recommend using WeDiscover’s free template.
Complete all of the exercises first to receive your certificate!
Share This Course