Our data is all over the place
As much as 60% of the work of a data scientist is collecting and cleaning data, before any actual modeling work can begin. Getting organized can give you a huge edge in finding insights quicker.
Analytical Base Table
Having all of your clean data in the right format in one place before you start modeling is essential...More


Our data is all over the place, it’s a real mess.
Can you get it all together in one spreadsheet for me?
Then the guys can start modeling…
This course is a work of fiction. Unless otherwise indicated, all the names, characters, businesses, data, places, events and incidents in this course are either the product of the author's imagination or used in a fictitious manner. Any resemblance to actual persons, living or dead, or actual events is purely coincidental.
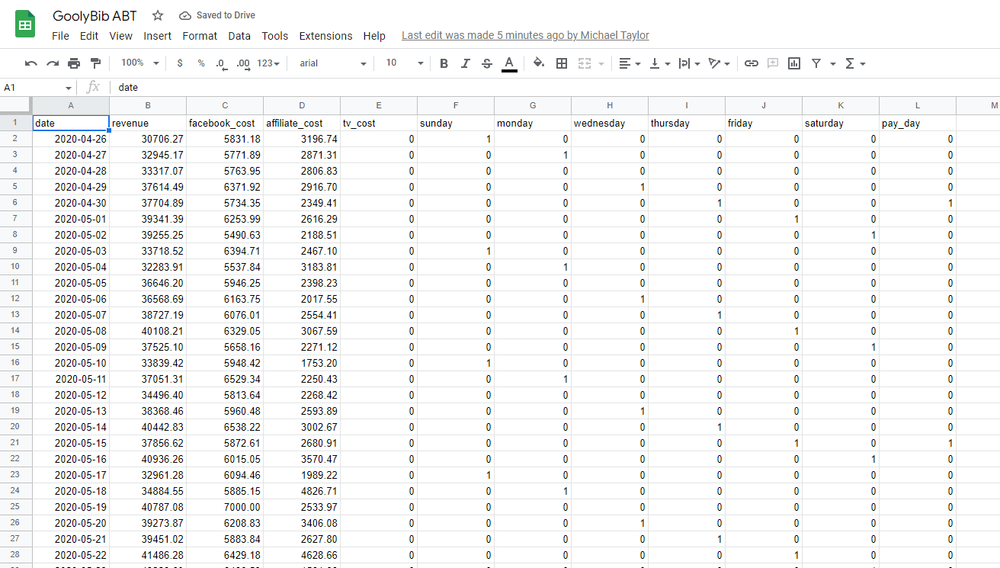
Before modeling can begin, it helps to get all the clean data merged together into one big spreadsheet. This is called the 'analytical base table' or ABT, and having one saved means you can separate the modeling stage from the data cleaning and collection stage. If an analyst ever wants to recreate your model or build a better one, they can use the ABT without having to worry about the data cleaning stage.
In order to get your ABT ready, you want to set up a spreadsheet with one column per variable that may (or may not) be used in the model. You also typically want one unique row per date or time period, which is what you join all of the different data sources together on.
You can use a vlookup formula to join two datasets together by date in Excel or GSheets. The formula is VLOOKUP(search_key, range, index, [is_sorted]). In our case the search key would be the date for that row, the range would be the data we're looking up to merge in, index would be the column you want to pull from, and is_sorted should be set to FALSE.
The best way in Excel or GSheets to create a dummy variable, is to use an IF statement that results in a 1 if true, 0 if false. For example if you wanted to add a dummy variable for every Friday, you could use the formula IF(TEXT(A1,"DDDD")='friday',1,0), where the date was in cell A1. Don't add a dummy for every day of the week: for example leave off Tuesdays otherwise you'll run into a 'linearly correlated variable' error.
Complete all of the exercises first to receive your certificate!
Share This Course